Estimation and model selection using ABC-SMC
Source:vignettes/estimation-and-model-selection-using-abc-smc.Rmd
estimation-and-model-selection-using-abc-smc.RmdModel definition
compute_dist <- function(x, ss_obs) {
  ss_sim <- c(x[["alpha"]] + x[["beta"]] + rnorm(1, 0, 0.1),
              x[["alpha"]] * x[["beta"]] + rnorm(1, 0, 0.1))
  dist <- sum((ss_sim - ss_obs)^2)
  return(c(dist))
}

compute_dist_2 <- function(x, ss_obs) {
  ss_sim <- c(x[["alpha"]] + x[["beta"]] + runif(1, -0.5, 0.5),
              x[["alpha"]] * x[["beta"]] + runif(1, -0.5, 0.5))
  dist <- sum((ss_sim - ss_obs)^2)
  return(c(dist))
}

compute_dist_3 <- function(x, ss_obs) {
  ss_sim <- c(x[["alpha"]] + x[["gamma"]] + rnorm(1, 1, 0.1),
              x[["alpha"]] * x[["gamma"]] + rnorm(1, 1, 0.1))
  dist <- sum((ss_sim - ss_obs)^2)
  return(c(dist))
}

model_list <- list("m1" = compute_dist,
                   "m2" = compute_dist_2,
"m3" = compute_dist_3)Create a reference trajectory
sum_stat_obs <- c(2.0, 0.75)Run abc smc procedure
res <- abcsmc(model_list = model_list,
              prior_dist = prior_dist,
              ss_obs = sum_stat_obs,
              max_number_of_gen = 20,
              nb_acc_prtcl_per_gen = 2000,
              new_threshold_quantile = 0.8,
              experiment_folderpath = "mdlslctn",
              max_concurrent_jobs = 5,
              verbose = FALSE)
Plot results
all_accepted_particles <- res$particles
all_thresholds <- res$thresholds
plot_abcsmc_res(data = all_accepted_particles, prior = prior_dist,
                filename = "mdlslctn/res/figs/mdlslctn_pairplot_all.png", colorpal = "YlGnBu")
#> [1] "Number of generations exceed the threshold (15) allowed by ggpairs, it may cause long processing times. You may (re)define the iter argument to choose which generations to plot."
#> [1] "Plot saved as 'png'."
plot_densityridges(data = all_accepted_particles, prior = prior_dist,
                   filename = "mdlslctn/res/figs/mdlslctn_densityridges.png", colorpal = "YlGnBu")
#> [1] "Plot saved as 'png'."
plot_thresholds(data = all_thresholds, nb_threshold = 1,
                filename = "mdlslctn/res/figs/mdlslctn_thresholds.png", colorpal = "YlGnBu")
#> [1] "Plot saved as 'png'."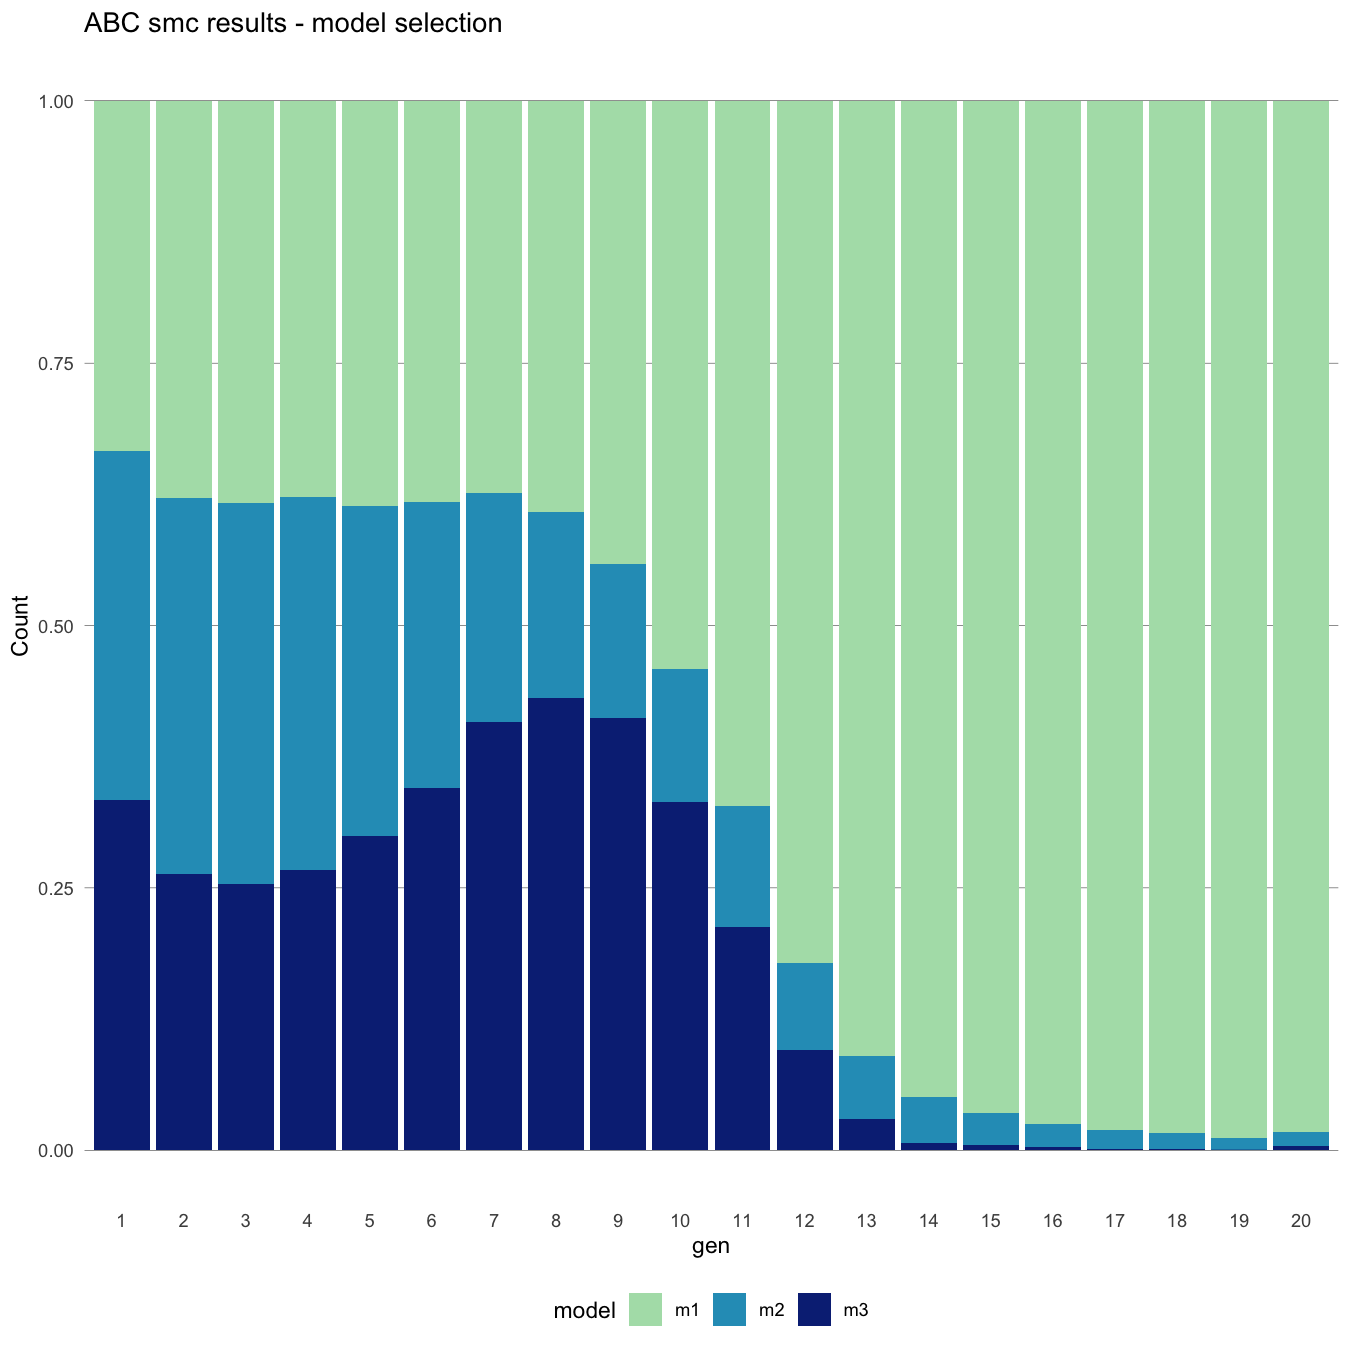
Selected models over iterations
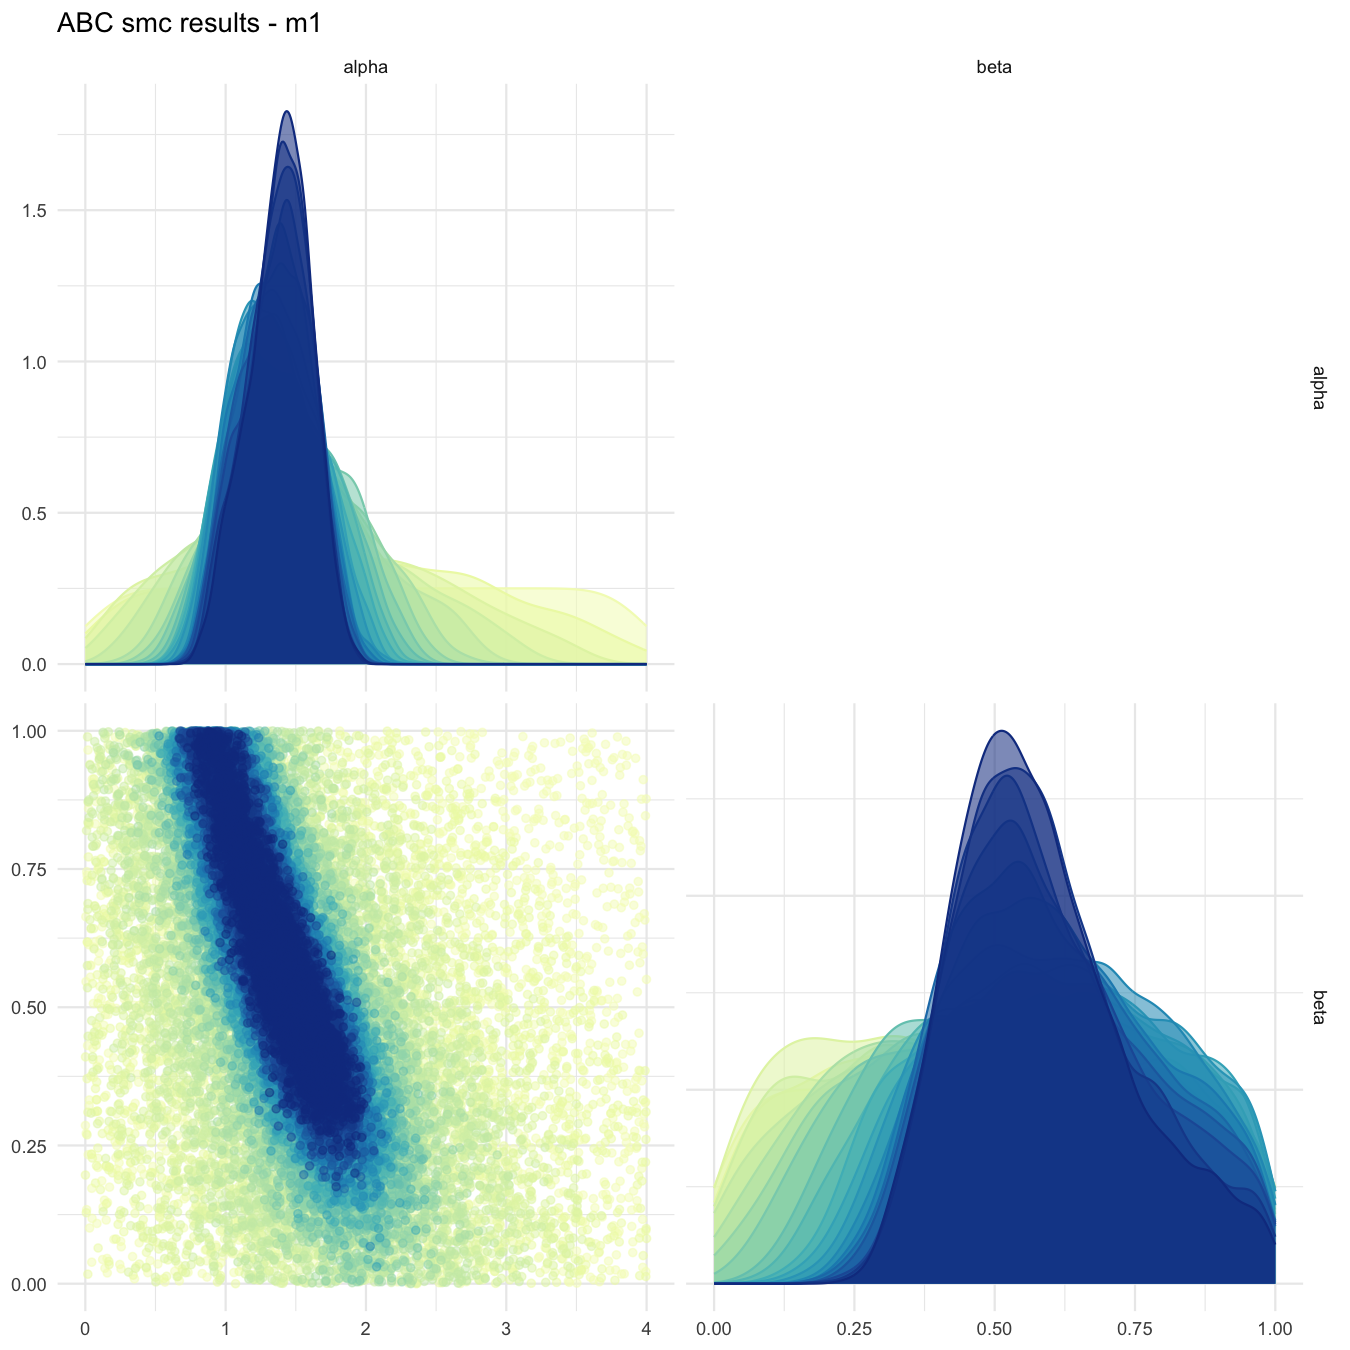
Pairplot of all iterations for the predominantly selected model
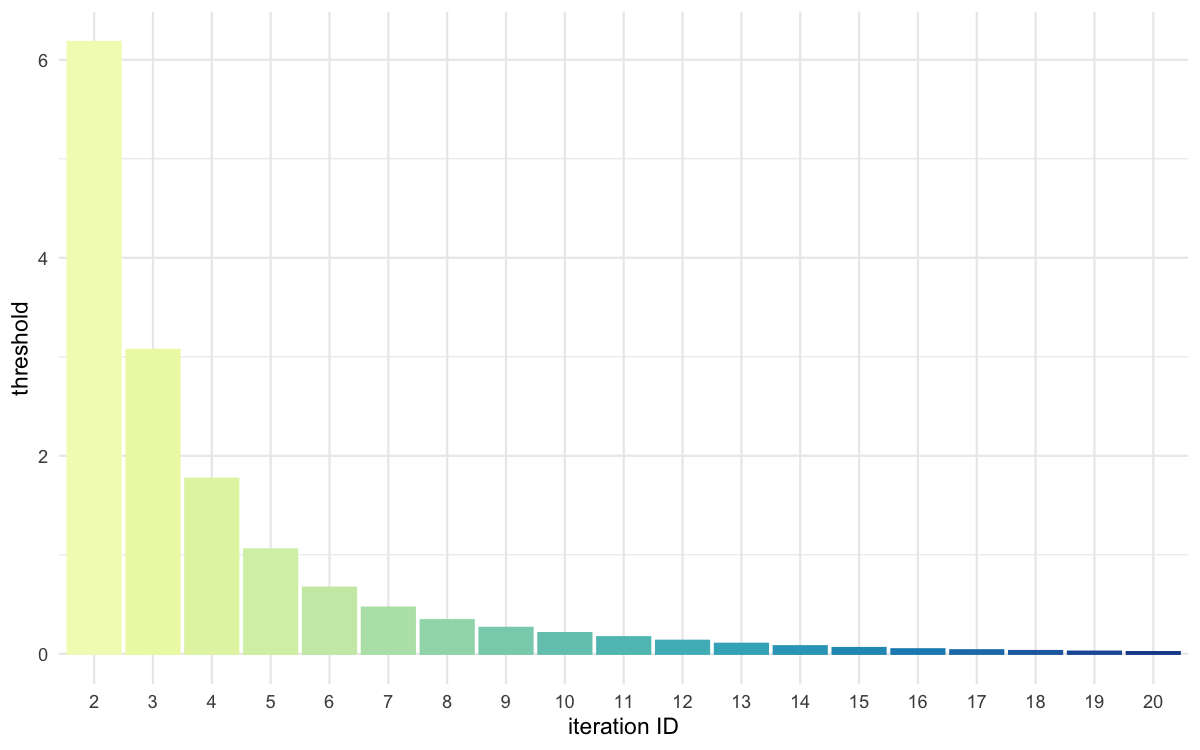
Threshold evolution over iterations for the predominantly selected model
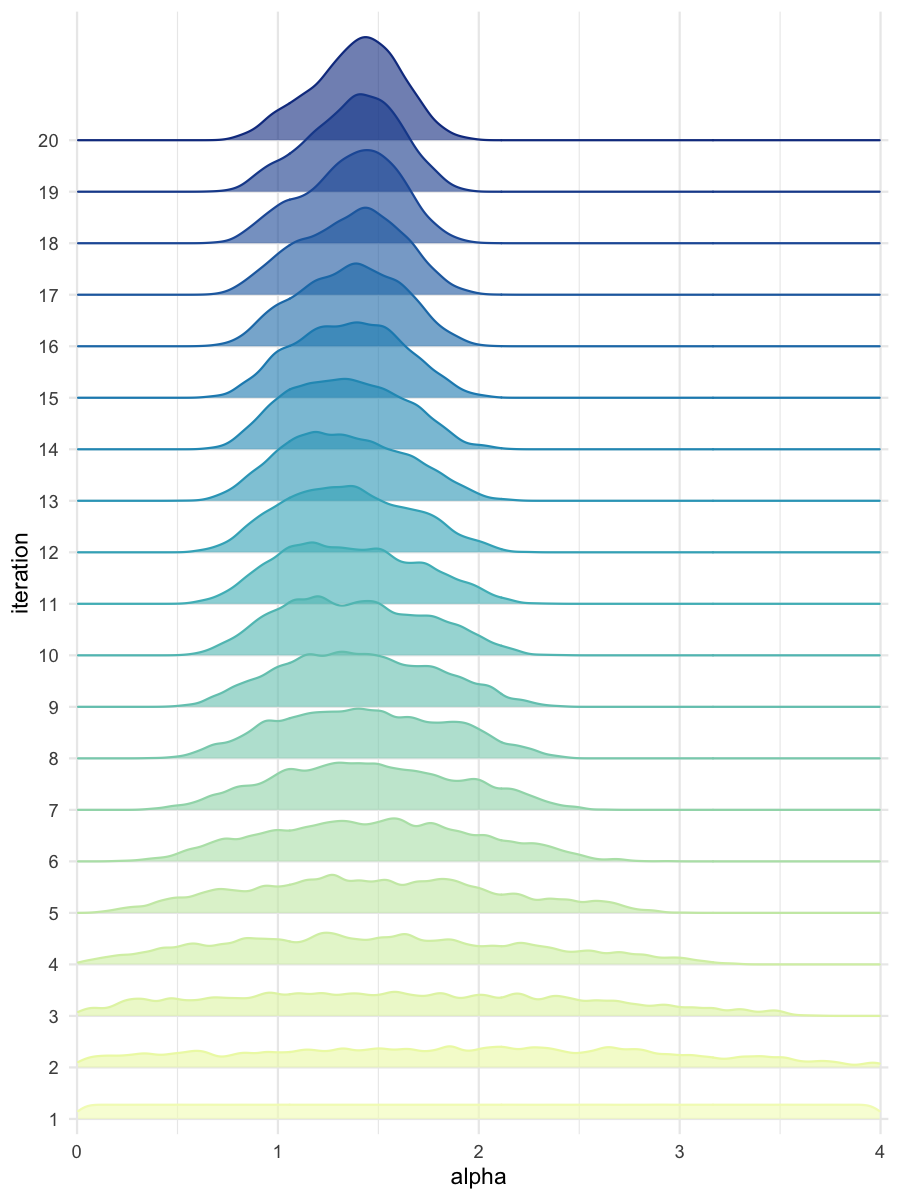
Density estimates of alpha, for the predominantly selected model
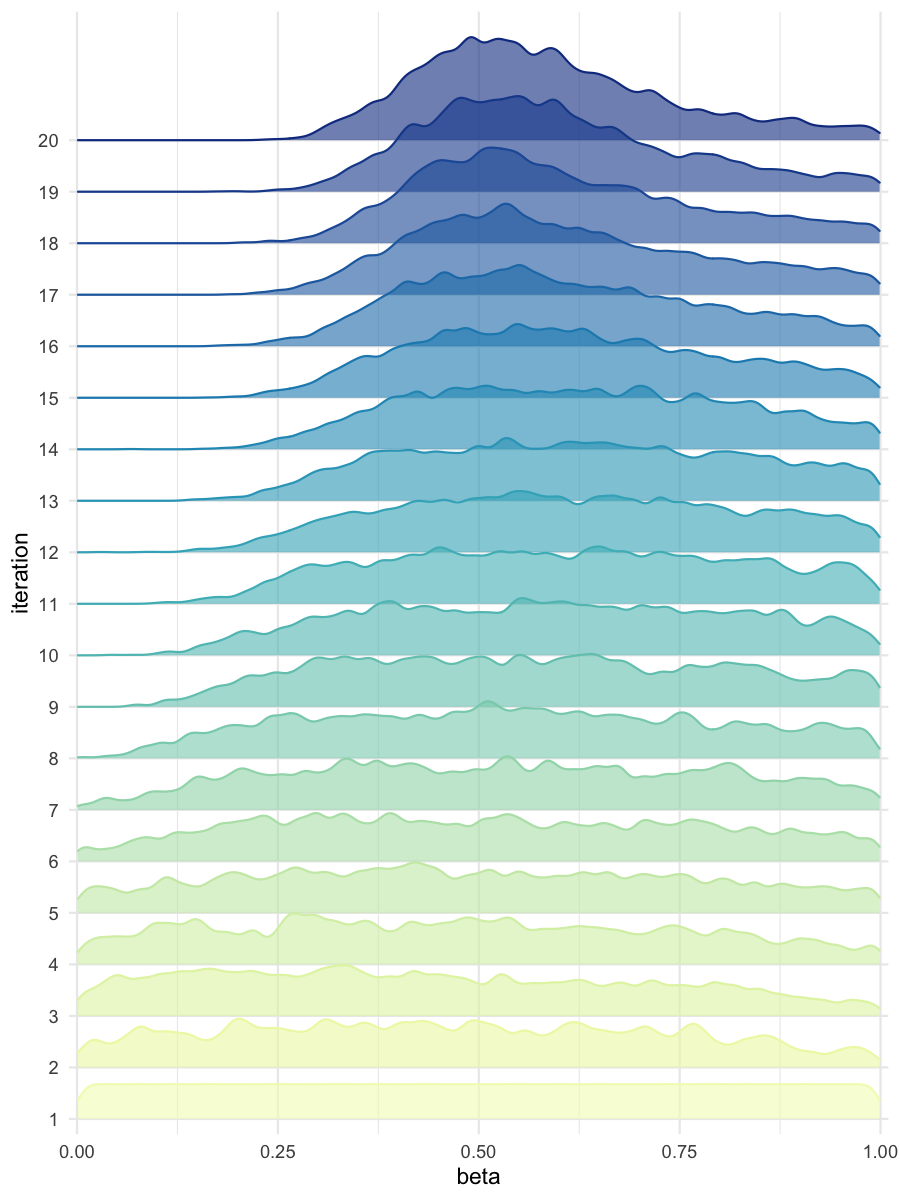
Density estimates of beta, for the predominantly selected model