Resume an estimation using ABC-SMC
Source:vignettes/resume-an-estimation-using-abc-smc.Rmd
resume-an-estimation-using-abc-smc.RmdCreate a reference trajectory
sum_stat_obs <- c(2.0, 0.75)Run abc smc procedure
res <- abcsmc(model_list = model_list,
              prior_dist = prior_dist,
              ss_obs = sum_stat_obs,
              max_number_of_gen = 10,
              nb_acc_prtcl_per_gen = 2000,
              new_threshold_quantile = 0.8,
              experiment_folderpath = "rsmsmpl",
              max_concurrent_jobs = 5,
              verbose = FALSE)
Plot results
all_accepted_particles <- res$particles
all_thresholds <- res$thresholds
plot_abcsmc_res(data = all_accepted_particles, prior = prior_dist,
                filename = "rsmsmpl/res/figs/rsmsmpl_pairplot_all.png", colorpal = "Greys")
#> [1] "Plot saved as 'png'."
plot_densityridges(data = all_accepted_particles, prior = prior_dist,
                   filename = "rsmsmpl/res/figs/rsmsmpl_densityridges.png", colorpal = "Greys")
#> [1] "Plot saved as 'png'."
plot_thresholds(data = all_thresholds, nb_threshold = 1,
                filename = "rsmsmpl/res/figs/rsmsmpl_thresholds.png", colorpal = "Greys")
#> [1] "Plot saved as 'png'."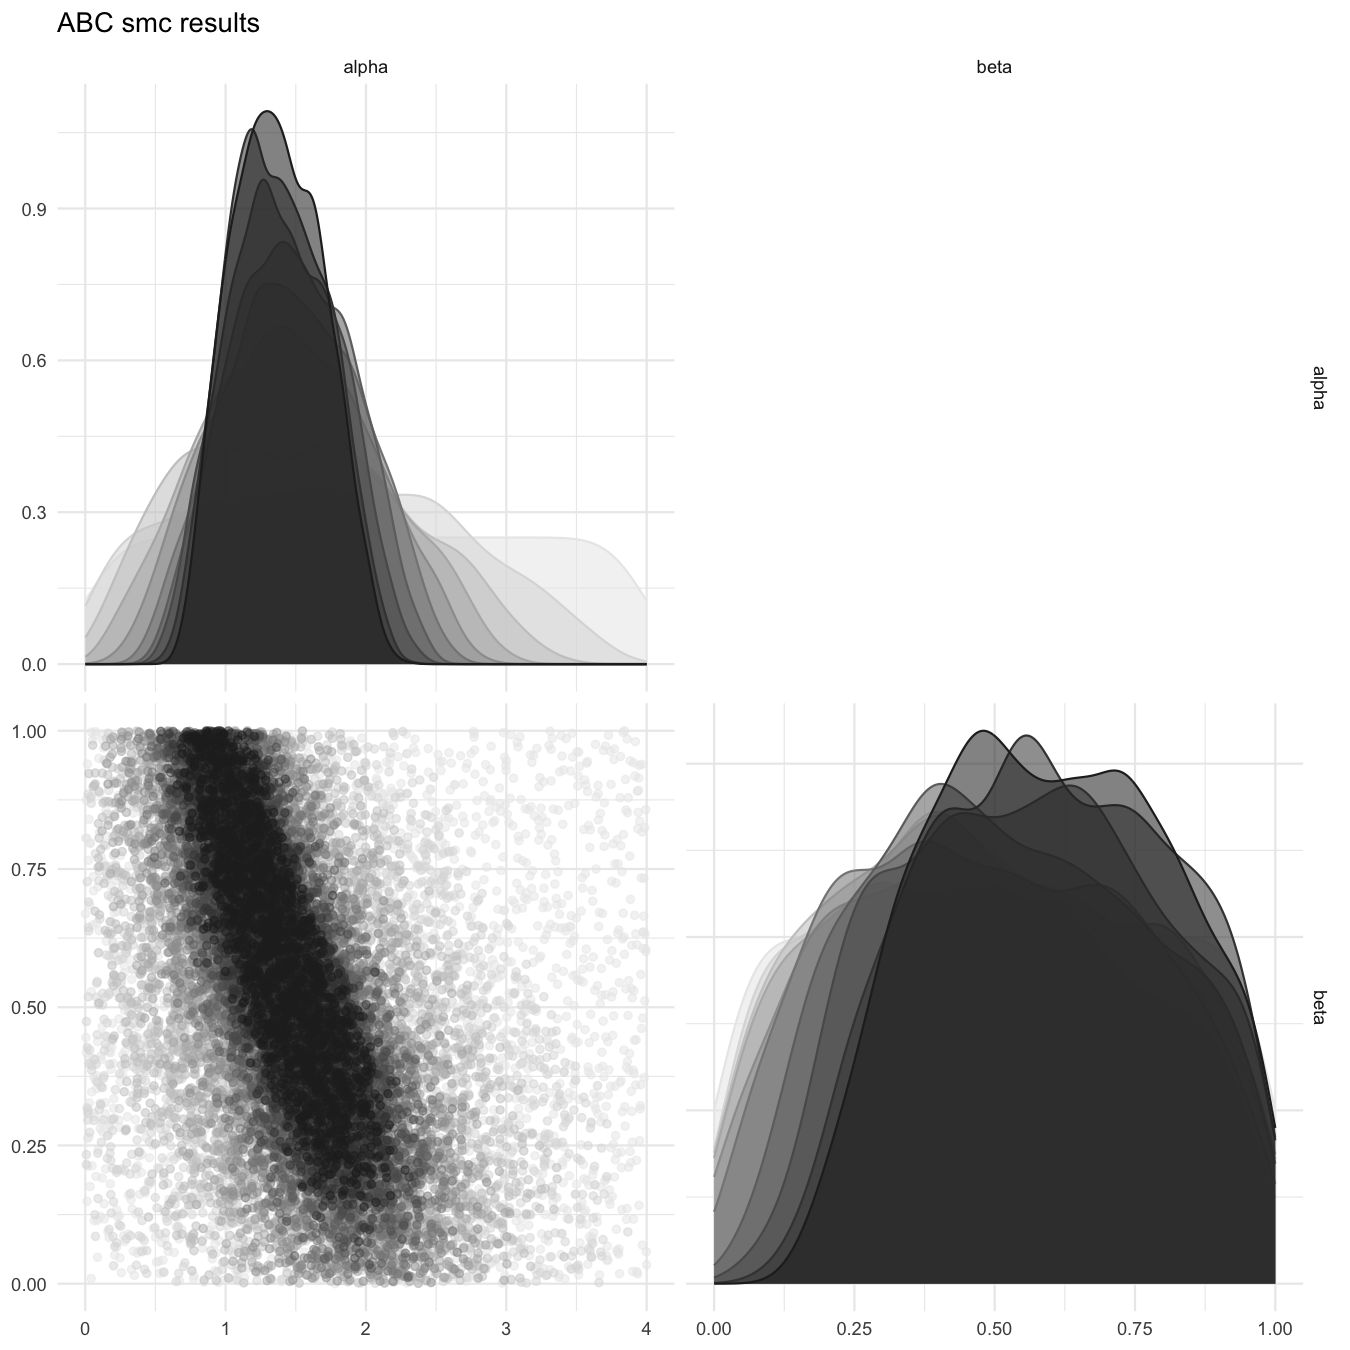
Pairplot of all iterations
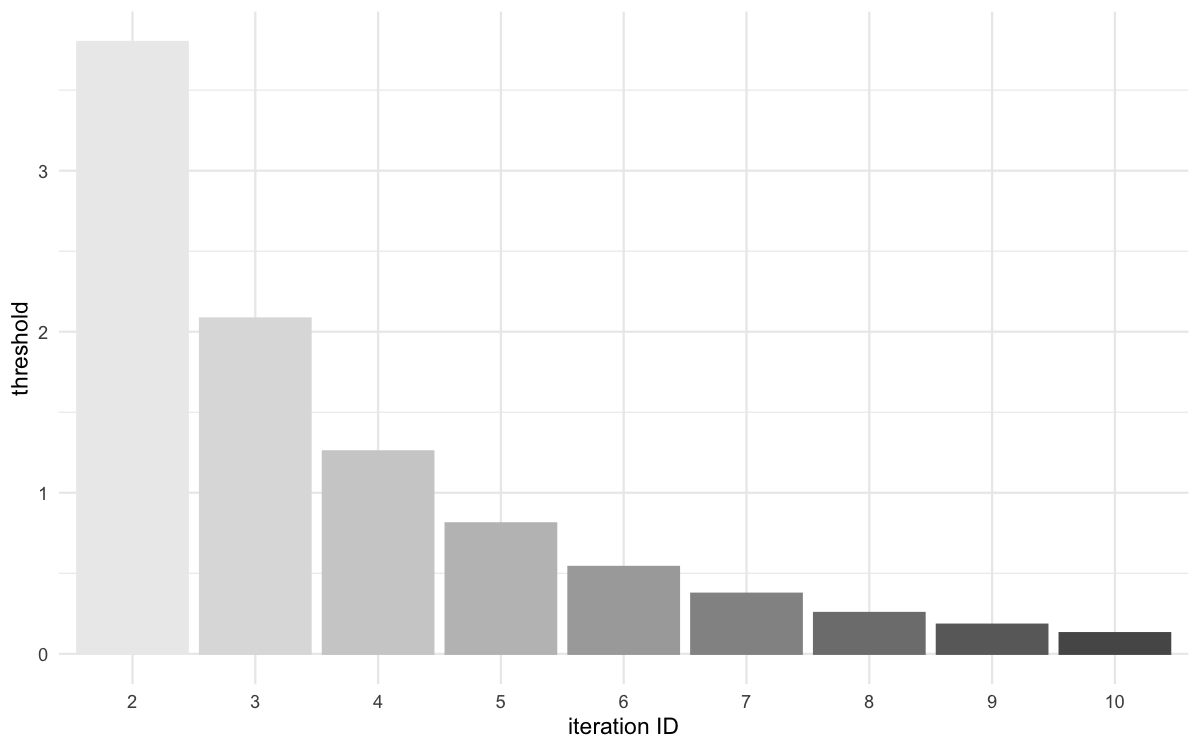
Threshold evolution over iterations
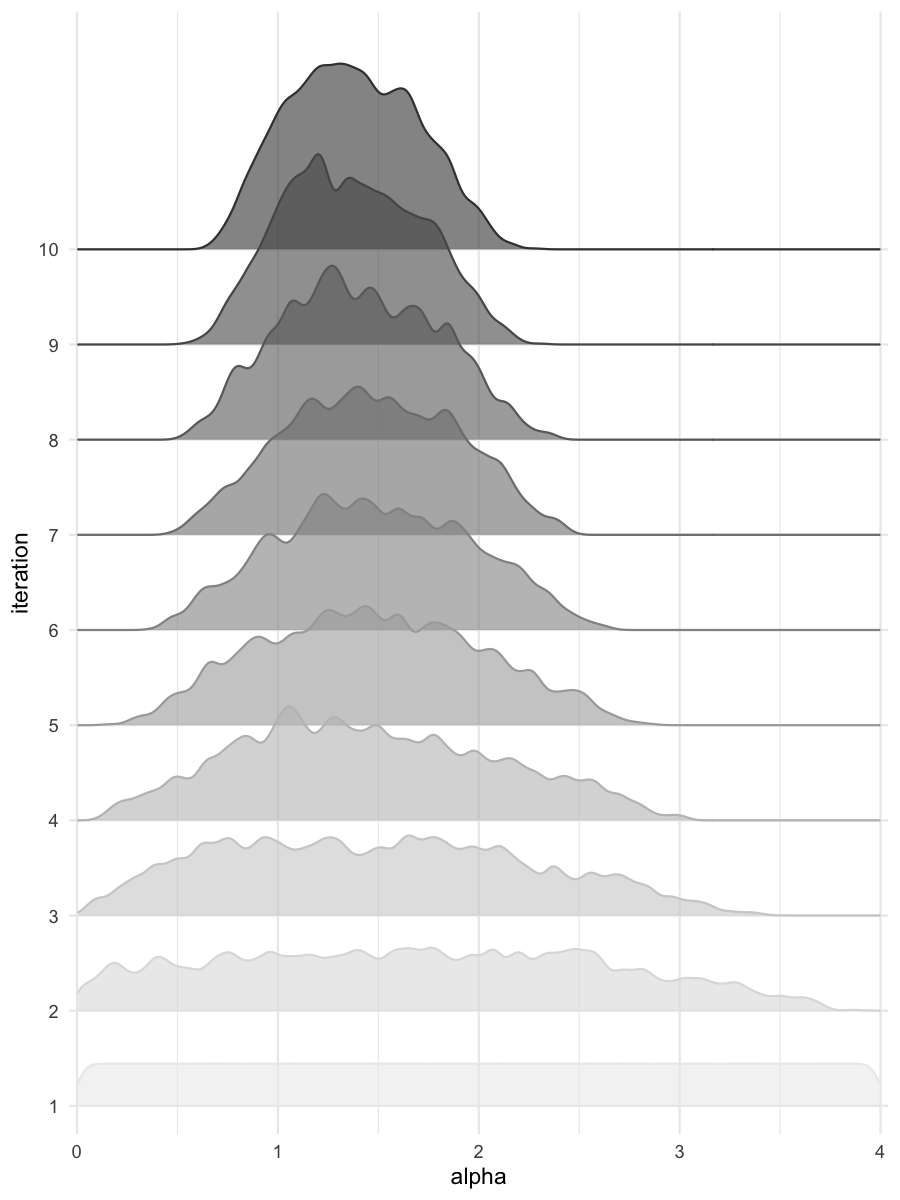
Density estimates for alpha
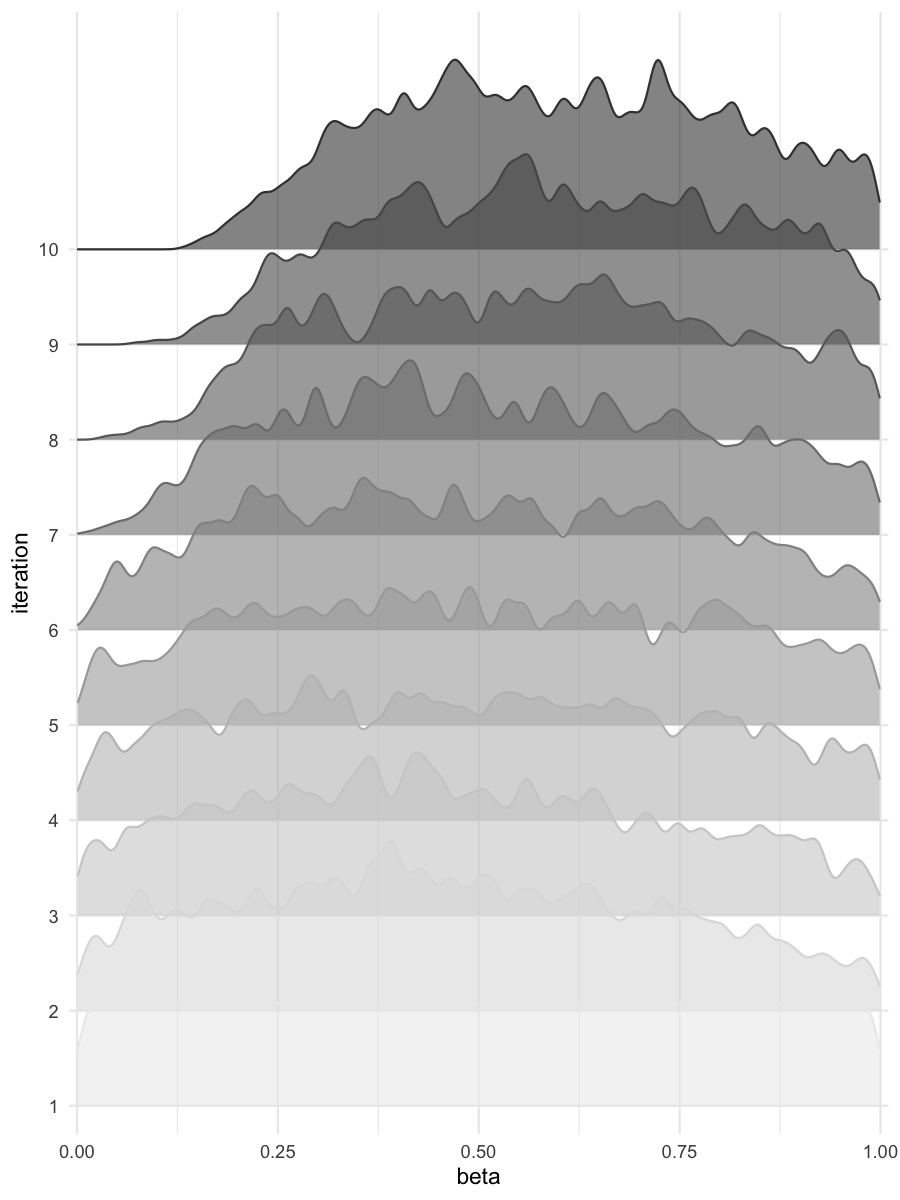
Density estimates for beta
Re-run abc smc procedure from last iteration of previous results
Be sure to update any parameters defining stopping conditions that
may have caused the previous procedure to terminate (here
max_number_of_gen).
res <- abcsmc(model_list = model_list,
              prior_dist = prior_dist,
              ss_obs = sum_stat_obs,
              max_number_of_gen = 20,
              nb_acc_prtcl_per_gen = 2000,
              new_threshold_quantile = 0.8,
              experiment_folderpath = "rsmsmpl",
              max_concurrent_jobs = 5,
              previous_gens = all_accepted_particles,
              previous_epsilons = all_thresholds,
              verbose = FALSE)
Plot new results
all_accepted_particles <- res$particles
all_thresholds <- res$thresholds
plot_abcsmc_res(data = all_accepted_particles, prior = prior_dist,
                filename = "rsmsmpl/res/figs/rsmsmpl_pairplot_all_rsm.png", colorpal = "OrRd")
#> [1] "Number of generations exceed the threshold (15) allowed by ggpairs, it may cause long processing times. You may (re)define the iter argument to choose which generations to plot."
#> [1] "Plot saved as 'png'."
plot_densityridges(data = all_accepted_particles, prior = prior_dist,
                   filename = "rsmsmpl/res/figs/rsmsmpl_densityridges_rsm.png",
                   colorpal = "OrRd")
#> [1] "Plot saved as 'png'."
plot_thresholds(data = all_thresholds, nb_threshold = 1,
                filename = "rsmsmpl/res/figs/rsmsmpl_thresholds_rsm.png", colorpal = "OrRd")
#> [1] "Plot saved as 'png'."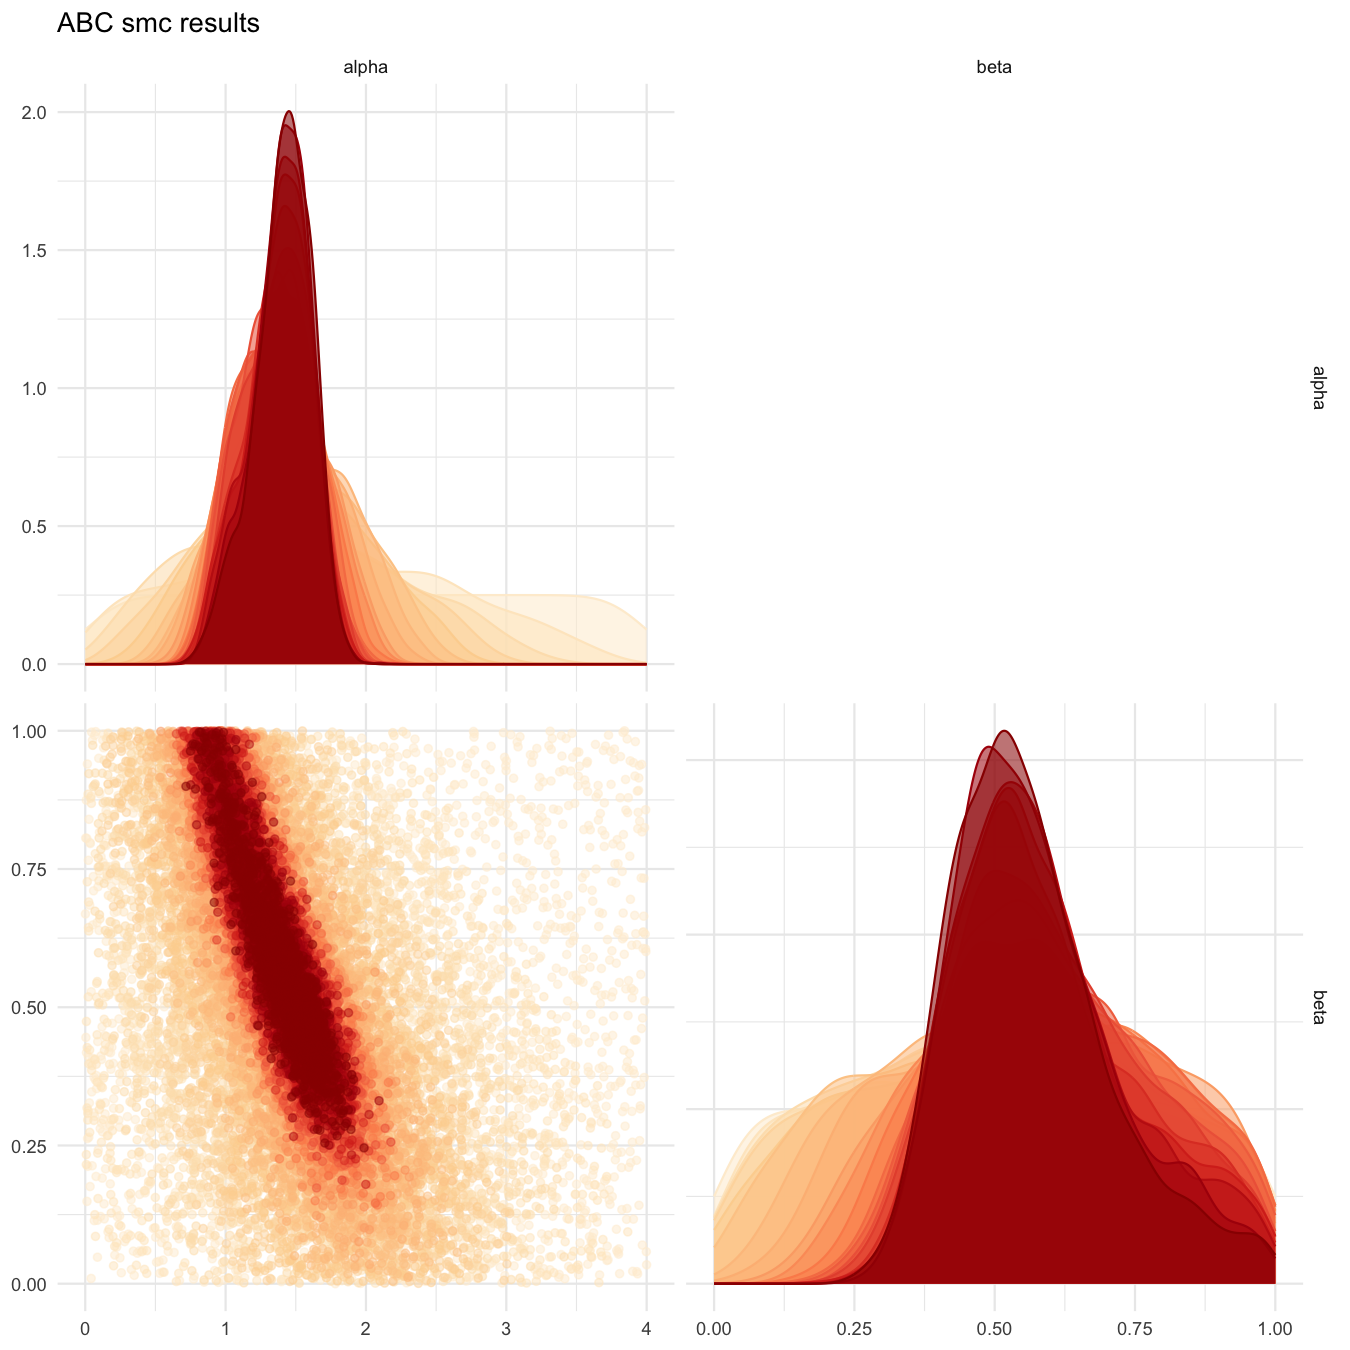
Pairplot of all iterations
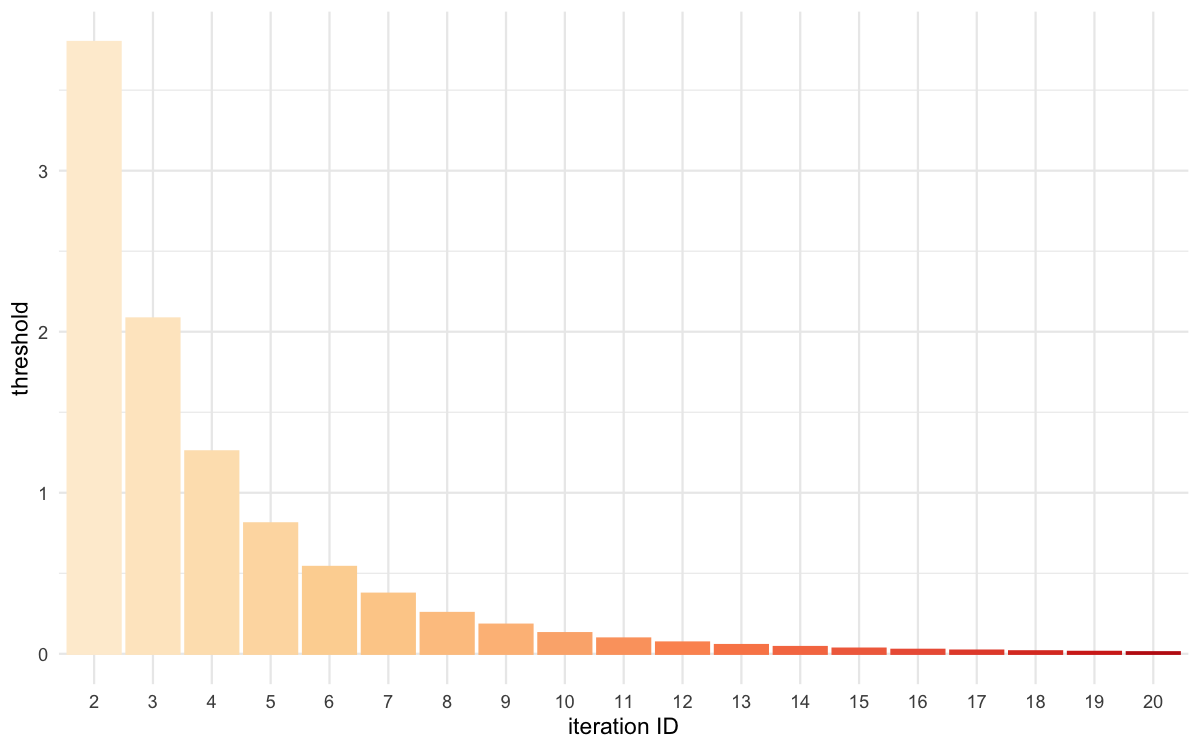
Threshold evolution over iterations
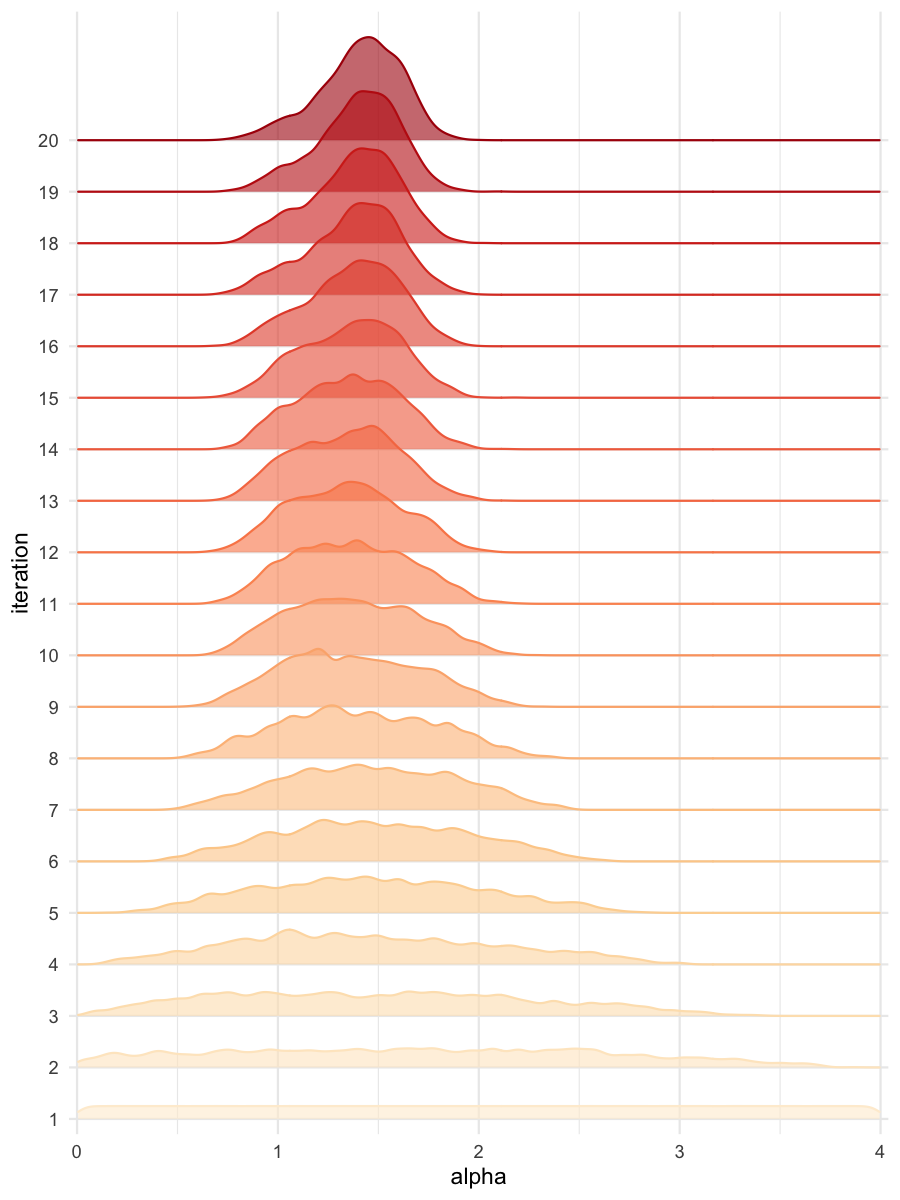
Density estimates for alpha
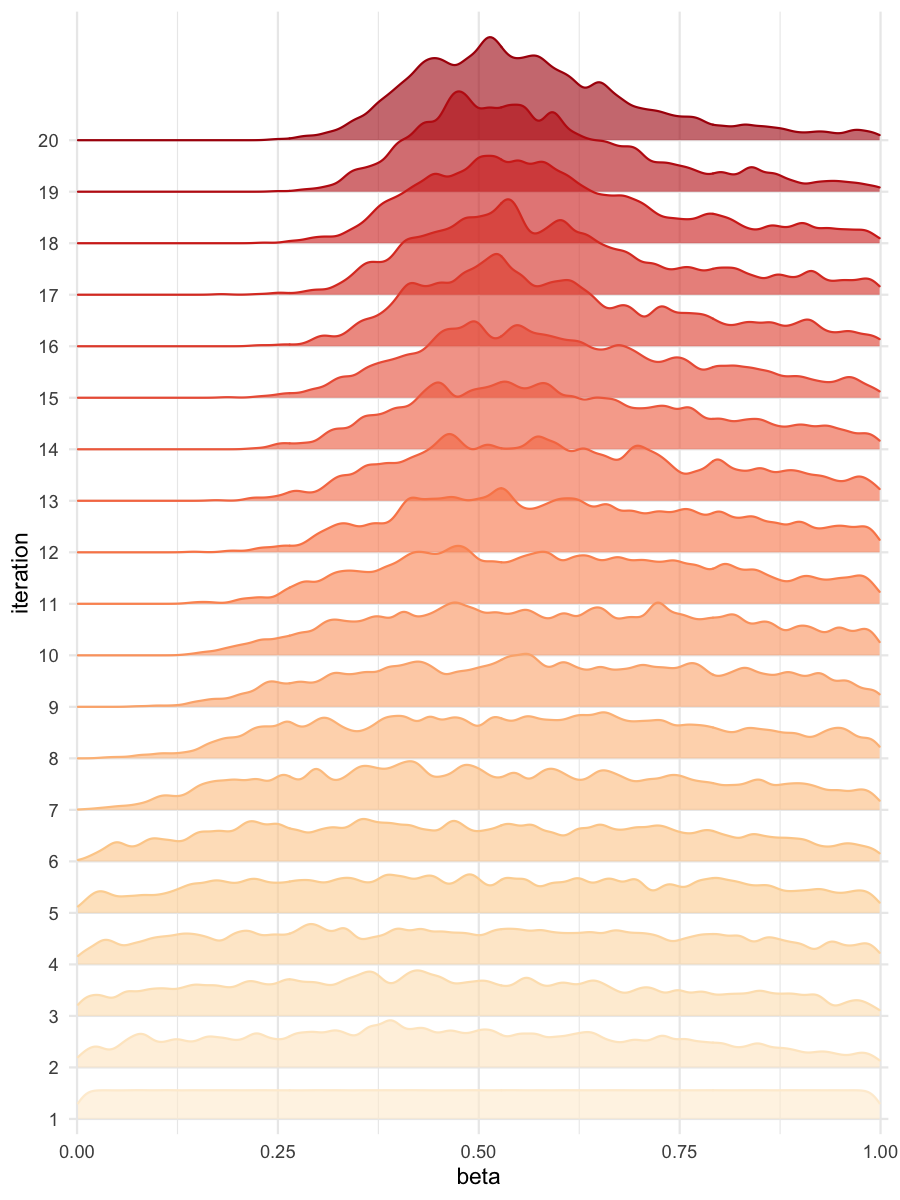
Density estimates for beta